
[english version]
This exercise is designed to demonstrate how PCA can simplify and clarify complex data, facilitating the analysis and interpretation of results.
You can review the analysis development and conclusions here:
https://rpubs.com/acastro/breast_tumor_en_PCA
![]() In this case, I use the «biopsy» dataset from the MASS package, one of the most popular and widely used in statistical analysis. It was developed by Venables and Ripley and accompanies the book «Modern Applied Statistics with S.»
In this case, I use the «biopsy» dataset from the MASS package, one of the most popular and widely used in statistical analysis. It was developed by Venables and Ripley and accompanies the book «Modern Applied Statistics with S.»
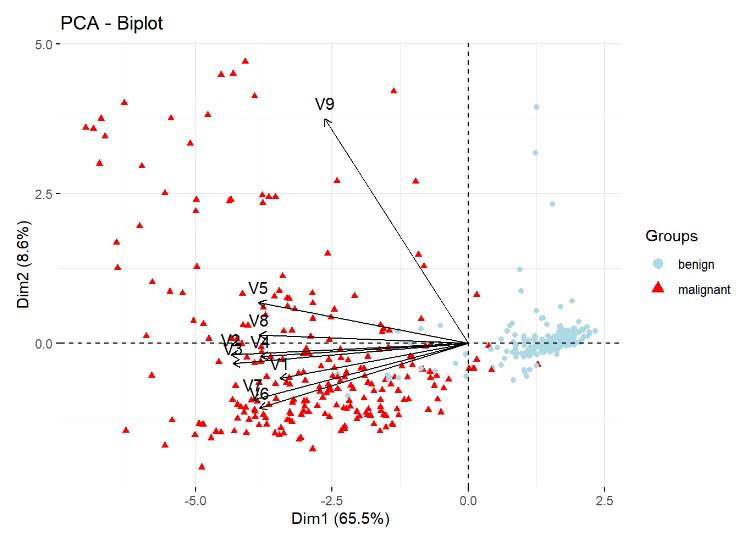
![]() The «biopsy» dataset contains information for classifying breast tumors as <benign> or <malignant> based on features obtained from fine needle aspiration biopsy images of breast masses. The data include both quantitative cellular features and the final tumor classification. It is a small and manageable dataset that provides a range of features for applying multiple modeling techniques and is ideal for teaching and experimenting with data analysis and machine learning. Additionally, it is well-documented and supported in the R MASS package.
The «biopsy» dataset contains information for classifying breast tumors as <benign> or <malignant> based on features obtained from fine needle aspiration biopsy images of breast masses. The data include both quantitative cellular features and the final tumor classification. It is a small and manageable dataset that provides a range of features for applying multiple modeling techniques and is ideal for teaching and experimenting with data analysis and machine learning. Additionally, it is well-documented and supported in the R MASS package.
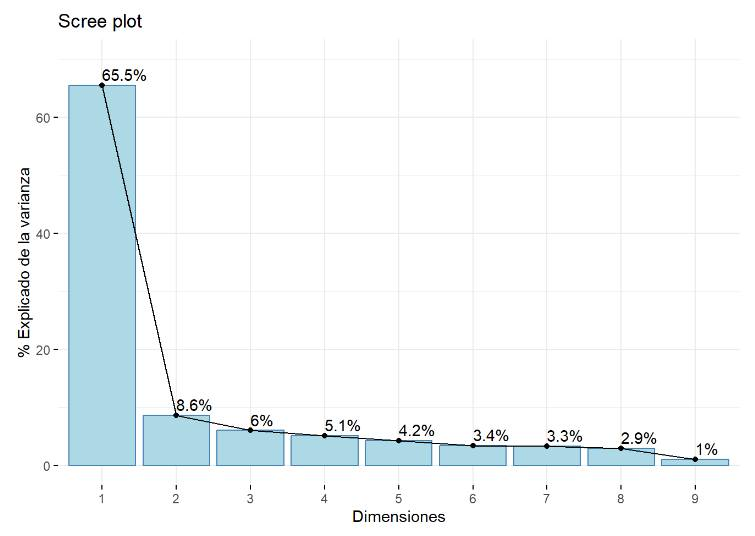
![]() PCA simplifies analysis and improves visualization and interpretation of results by transforming the original variables into a new set of principal components or factors. These components retain the maximum amount of information while using fewer dimensions. Thus, the first principal component explains most of the variance in the data, while each subsequent component captures the remaining variance without overlapping with the information already explained by the previous components. PCA is particularly valuable for large datasets, as it enables significant simplification of analysis and effective visualization without sacrificing relevant information.
PCA simplifies analysis and improves visualization and interpretation of results by transforming the original variables into a new set of principal components or factors. These components retain the maximum amount of information while using fewer dimensions. Thus, the first principal component explains most of the variance in the data, while each subsequent component captures the remaining variance without overlapping with the information already explained by the previous components. PCA is particularly valuable for large datasets, as it enables significant simplification of analysis and effective visualization without sacrificing relevant information.
This exercise not only demonstrates the power of PCA in biomedical data analysis but also serves as a resource for those learning multivariate analysis techniques in R. I hope you find it interesting, if applicable.